Space Equities Quantitative Investing [Concept]
The article explores how alternative data streams (such as satellite telemetry, radio frequency monitoring, and government procurement filings) could be converted into actionable alpha.

This guide provides a framework for designing and deploying quantitative investment strategies dedicated to the space sector. The article explores how alternative data streams (such as satellite telemetry, radio frequency monitoring, and government procurement filings) could be converted into actionable alpha.
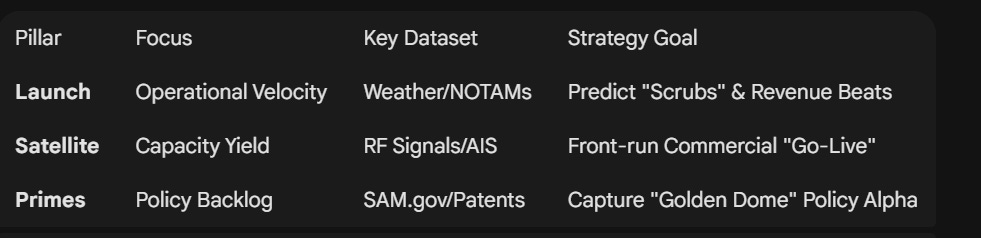
I. Launch & Logistics (The “Cadence” Factor)
These companies are the “rails” of the sector. Their stock price is highly sensitive to operational tempo and reliability.
1. Stocks
Rocket Lab (RKLB), Firefly Aerospace (FLY), Starfighters Space (FJET), Avio S.p.A., Intuitive Machines (LUNR), Momentus (MNTS), Virgin Galactic (SPCE).
2. Example Data Sources
Space-Track (TLE Data): Real-time orbital injection confirmation.
FAA NOTAMs: “Notice to Air Missions” (Leading indicator of launch readiness).
Weather Telemetry: High-altitude wind patterns at Cape Canaveral/Mahia (Predicts “scrub” probability).
3. Possible Quant Strategies (Launch & Sentiment)
A. The “Launch Lead-Time” Arbitrage
This strategy could exploit the information lag between technical launch readiness and public PR announcements.
Signal:
Monitor FAA NOTAMs (Notice to Air Missions) and TFRs (Temporary Flight Restrictions).
In 2026, spaceports like Mahia (Rocket Lab) and Kennedy Space Center issue these 3–7 days before a launch.
Quantitative Logic:
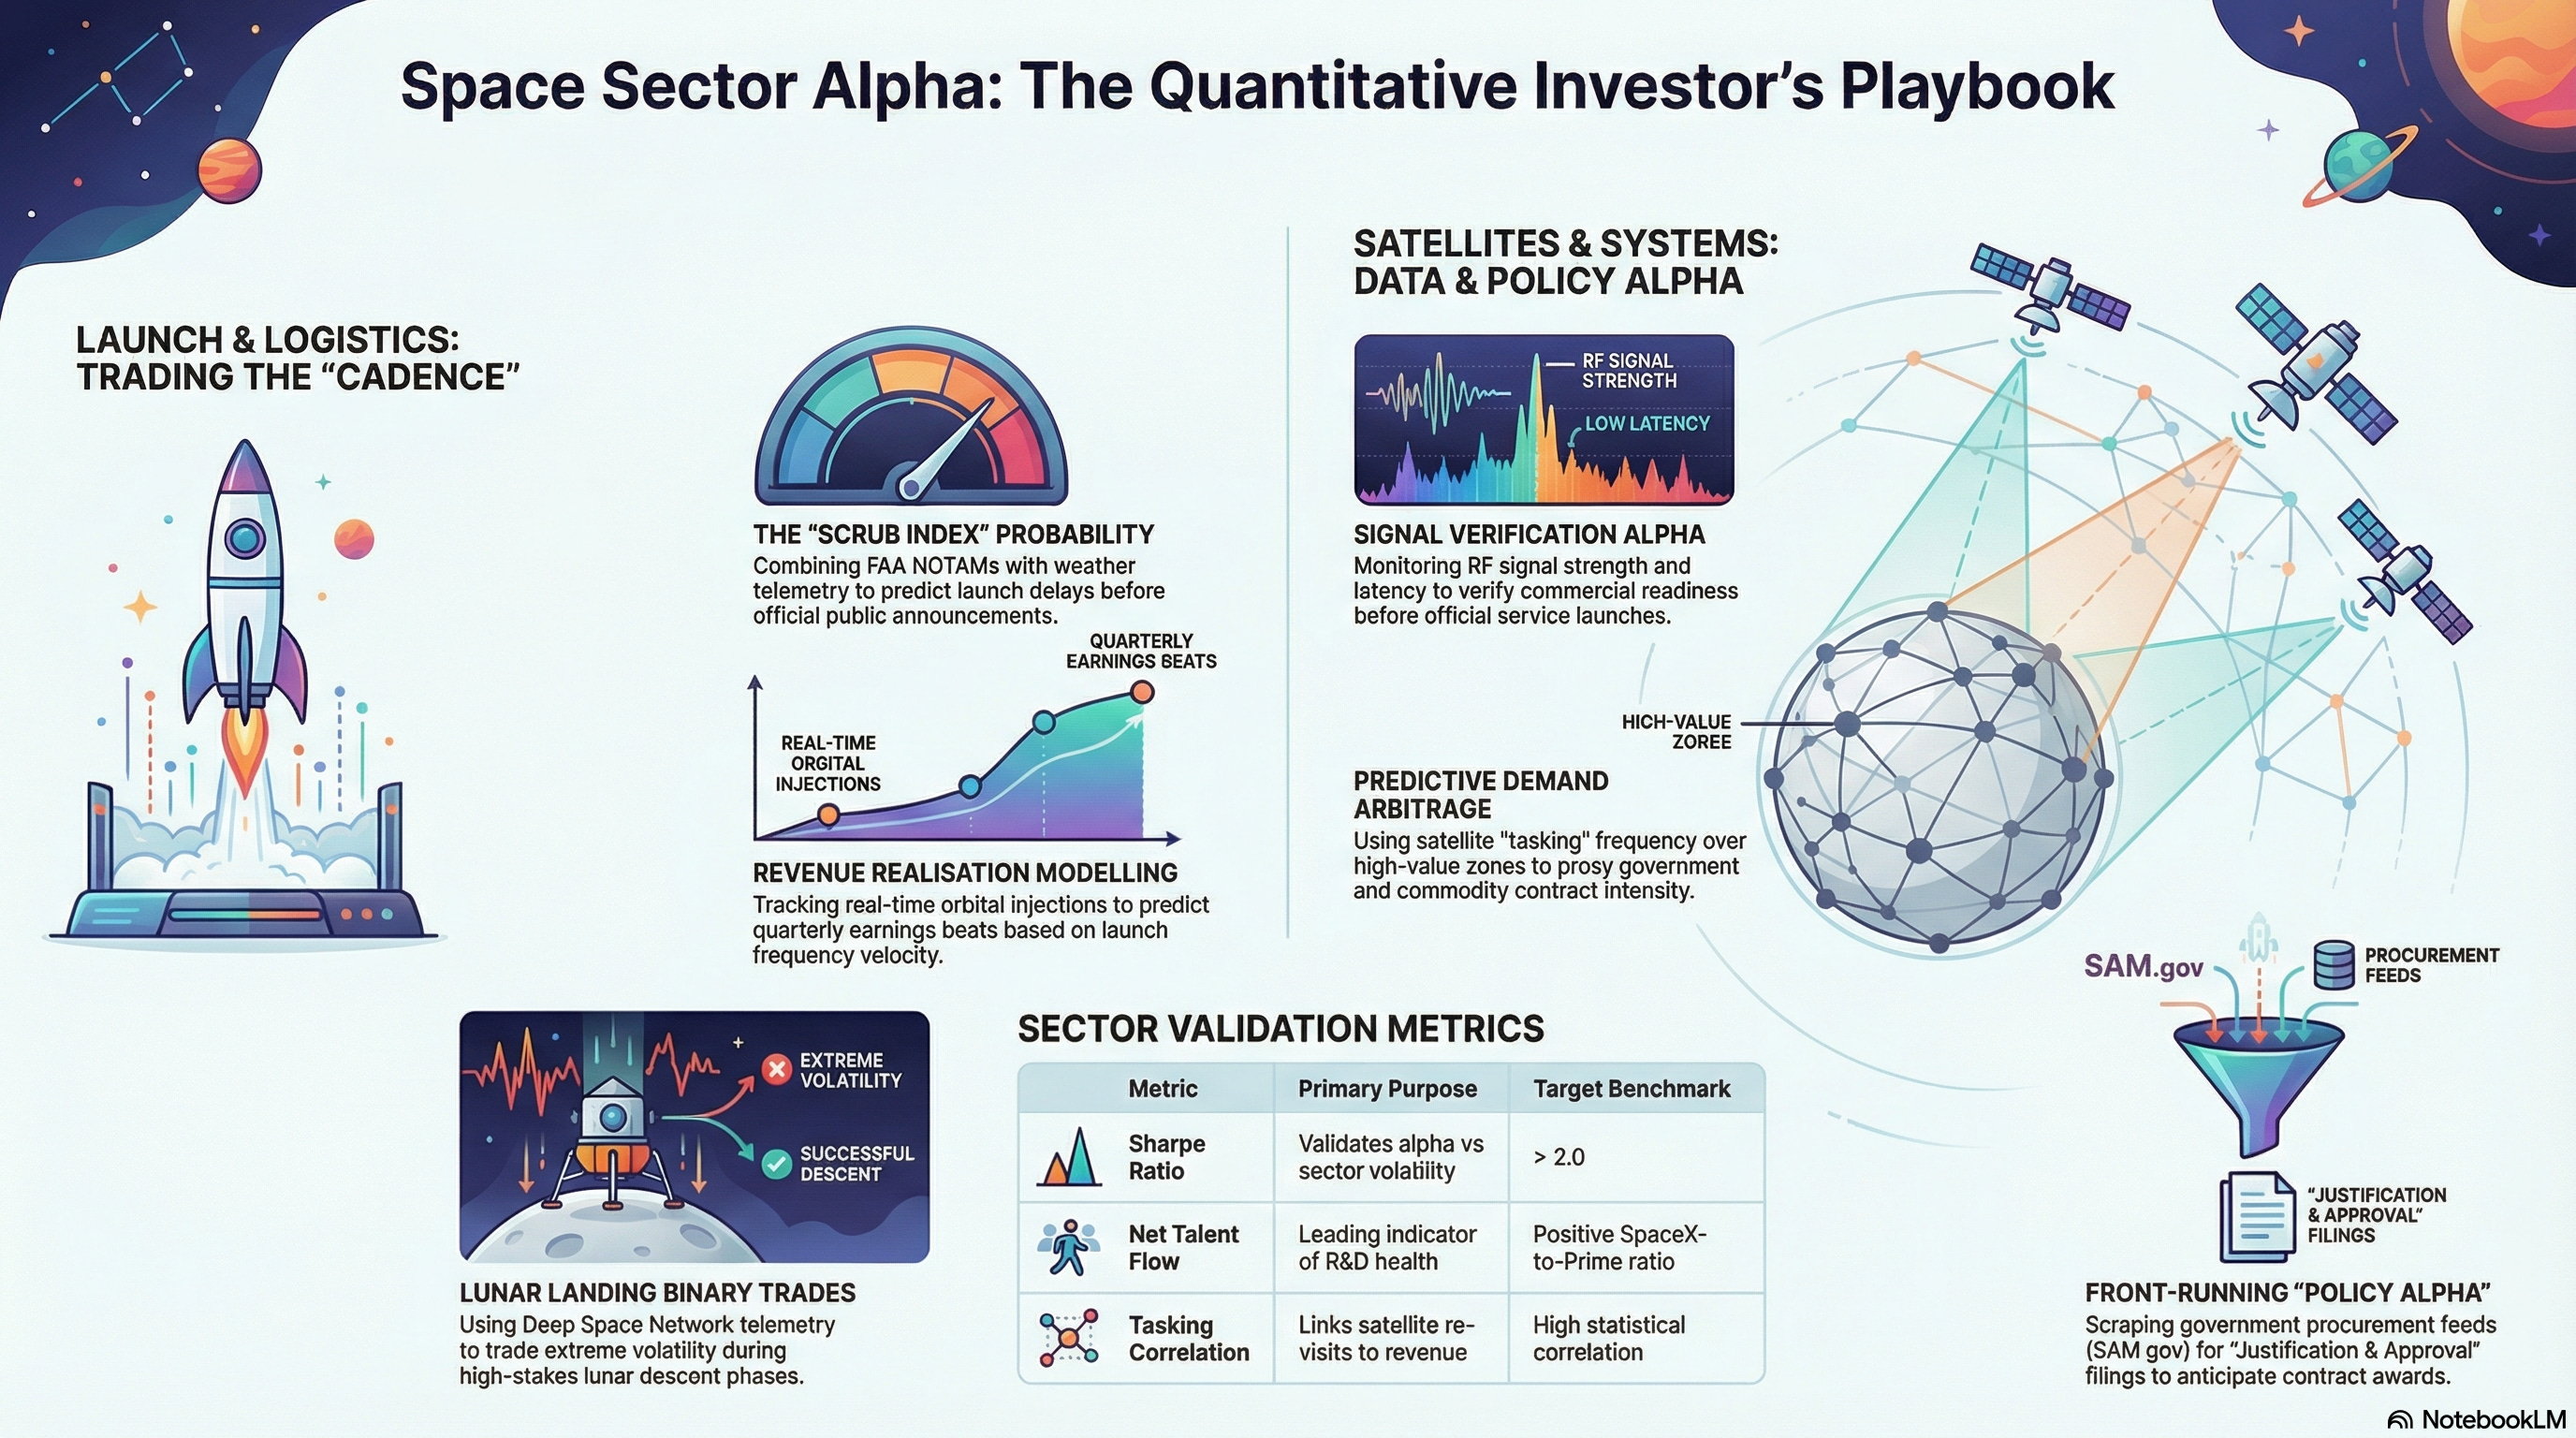
Create a “Scrub Index” by cross-referencing NOTAM dates with real-time weather telemetry (specifically upper-level wind shear and lightning commit criteria).
Example Trades:
If the NOTAM is active but weather telemetry shows a >80% “Probability of Violation” (POV), the model sells the short-term volatility.
Conversely, if weather is “Clear-to-Go” and the NOTAM is active, the model goes long 48 hours before the official “Launch Window” PR, capturing the retail momentum build-up.
B. Revenue Realization Modeling (The Cadence Factor)
A launch company’s revenue is a “counting process.” You can model the probability of specific mission counts to predict quarterly earnings beats.
Signal:
Real-time mission tracking via Space-Track (TLE data) to confirm successful orbital injections.
Quantitative Logic:
The model tracks the company’s average launch frequency (cadence) against current-quarter performance.
By month 2 of a fiscal quarter, the system calculates the statistical probability of the firm hitting its stated guidance based on the current “velocity” of launches.
Example Trades:
Long positions are opened in RKLB or Avio when the “Cadence Acceleration” factor exceeds the 12-month moving average by 1.5 standard deviations.
This potentially identifies an operational “breakout” before the financial markets price in the increased revenue.
C. The “Lunar Landing” Binary Trade (LUNR/iSpace)
Lunar missions are the “Biotech Trials” of the space sector; characterized by high-stakes, binary outcomes and extreme volatility.
Signal:
Use DSN (Deep Space Network) Telemetry tracking. Public data from NASA’s Eyes or amateur radio-astronomy aggregates provide a real-time status of the spacecraft’s lunar descent.
Quantitative Logic:
Sentiment Skew: Measure the “IV (Implied Volatility) Crush” leading up to the landing.
Telemetry Correlation: If signal lock is maintained during the “10 minutes of terror” (the final descent phase), but the stock price hasn’t yet reacted, an automated execution engine triggers a “Momentum Long” in anticipation of a successful landing confirmation.
Example Trades:
Use a Long Straddle (buying both puts and calls) 24 hours before the landing window.
Since 2026 volatility for Intuitive Machines (LUNR) typically exceeds 400% during these events, the strategy profits from the massive price swing regardless of whether the landing is a success or a failure.
II. Satellite Operators & D2C (The “Yield” Factor)
Their value is in the data they generate or the connections they facilitate.
A. Stocks
AST SpaceMobile (ASTS), Planet Labs (PL), Spire Global (SPIR), BlackSky (BKSY), Globalstar (GSAT), Viasat (VSAT), Echostar (SATS), SES S.A., Telesat, Sidus Space (SIDU).
B. Example Data Sources
RF Signal Strength Monitoring: Monitoring D2C (Direct-to-Cell) signal viability for ASTS.
Ship/Plane AIS Data: Cross-referencing Spire/Planet data with global logistics to verify “Data Demand.”
Spectrum Auction Results: Real-time monitoring of FCC/ITU filings.
3. Possible Quant Strategies (Satellite & Demand)
A. The “Signal Verification” Alpha (ASTS/GSAT)
This strategy targets the “Testing-to-Commercialization” gap. As AST SpaceMobile and Globalstar move from intermittent to continuous service, the market reacts violently to successful signal-lock milestones.
Signal:
Monitor RF (Radio Frequency) Monitoring Networks and amateur satellite tracking logs.
Specialized RF hobbyist communities and commercial signal-intelligence firms track the downlink signal strength of new “BlueBird” or Globalstar satellites before official PRs.
Quantitative Logic:
Signal Reliability Score: Create a proprietary score based on the consistency of the “handshake” between the satellite and standard 5G smartphones in “dead zones.”
Latency Thresholds: As ASTS aims for 120 Mbps speeds in early 2026, any verified signal exceeding the 100 Mbps threshold in field tests serves as a leading indicator of a successful commercial launch.
Example Trades:
The model opens a Long ASTS position when crowdsourced RF signal data shows >95% signal stability over a 48-hour period in three different geographic “test cells” (e.g., US, Japan, and Brazil) before the company announces “Service Ready” status.
B. Predictive Demand Arbitrage (PL/BKSY/SPIR)
Earth Observation (EO) companies like Planet Labs and BlackSky are often “tasked” (hired to take specific photos) by governments or commodity traders. This strategy predicts revenue by tracking where the satellites are looking.
Signal:
Monitor Satellite Tasking Metadata and AIS (Automatic Identification System) ship-tracking data.
The frequency of satellite “re-visits” over high-value zones (such as the South China Sea or lithium mining basins) is a direct proxy for government contract intensity.
Quantitative Logic:
The Tasking Multiplier: Quantify the “Daily Re-visit Rate.” If Planet Labs’ SkySats increase imaging frequency over specific conflict or trade zones by >30% month-over-month, the model flags an increase in Defense & Intelligence revenue (which grew 41% YoY in early 2026).
Supply-Chain Correlation: Cross-reference AIS ship-congestion data at major ports with BlackSky’s imaging cadence to predict if commercial logistics firms are increasing their “Space Data” spend.
Example Trades:
Go Long PL or BKSY when the “Tasking Velocity” over critical infrastructure zones exceeds the 3-month moving average by 2 standard deviations, anticipating a Remaining Performance Obligation (RPO) beat in the next earnings report.
C. Transponder Utilization & Churn Modeling (VSAT/SES/SATS)
Legacy and hybrid satellite giants rely on “Filling the Pipe.” Their profitability depends on how much of their massive transponder capacity is actually being used by internet providers and broadcasters.
Signal:
Analyze Global Internet Traffic Flow and CDN (Content Delivery Network) logs. Tools like Satformer use neural networks to estimate the data volume being transmitted between satellite nodes and ground stations in real-time.
Quantitative Logic:
The “Dead Zone” Index: Map global internet traffic against the known orbital paths of Viasat or SES satellites. If data traffic in remote regions (where terrestrial fiber is absent) shows a sudden drop, it predicts a “Churn Event” for the operator’s high-margin enterprise clients.
Capacity Fill-Rate: Track the ratio of “Allocated vs. Active” bandwidth. A rising fill-rate in the Ka-band indicates pricing power, whereas an empty transponder is a “sunk cost” liability.
Example Trades:
Execute a Mean-Reversion Trade on VSAT or SES S.A. If real-time traffic data shows a steady +10% increase in regional data throughput while the stock remains flat, the model initiates a long position to capture the “Utilization Alpha” before the company reports improved Net Margins.
III. Subsystem & Component Primes (The “Backlog” Factor)
These firms provide the hardware, AI chips, and specialized materials. They are the most sensitive to government policy shifts. For these stocks, quant analysis provides a superior edge by capturing “Policy Alpha”; the predictable flow of capital from government defense bills into small-cap engineering firms.
1. Stocks
Redwire (RDW), MDA Space, Karman Space & Defense (KRMN), Kratos (KTOS), Aerovironment (AVAV), Filtronic, Calian Group, York Space, AAC Clyde Space, Gomspace, OHB SE, Syntec Optics (OPTX), Velo3D (VLD).
2. Example Data Sources
Govini/SAM.gov APIs: Real-time defense procurement feeds.
Patent Velocity: Tracking R&D dominance in radiation-hardening and laser-comms.
Glassdoor/LinkedIn Talent Flows: Monitoring engineer poaching between SpaceX and mid-cap primes as a proxy for R&D health.
3. Possible Quant Strategies (Backlog Realization)
A. The “Patent Velocity” Moat Analysis (RDW/OPTX)
In the 2026 space race, technology moats are defined by Radiation-Hardening and In-Space Manufacturing. Companies that out-pace their peers in IP filing frequency are statistically more likely to win “Sole Source” government contracts.
Signal:
Use NLP (Natural Language Processing) to scrape the USPTO and WIPO databases for new filings under specific CPC (Cooperative Patent Classification) codes like B64G (Cosmonautics).
Quantitative Logic:
Innovation Continuity: Measure the “Forward Citation” count. If a patent from Redwire (RDW) is cited by a larger prime (like Lockheed) or a competitor (like York Space), it indicates Redwire’s tech is becoming a “Standard Essential” component.
The White Space Factor: Identify “Blue Oceans”; technological areas (e.g., Very Low Earth Orbit (VLEO) thermal management) where a company has a high density of patents but zero competitors.
Example Trades:
The model initiates a Long RDW or Syntec Optics (OPTX) position when their “Patent Velocity” in Optical Laser Comms increases by 40% over a rolling 6-month period, preceding the likely award of a Space Force “Link 16” integration contract.
B. The “Golden Dome” Contract Trigger (KTOS/AVAV)
With the implementation of the 2026 Space Executive Order, the U.S. has shifted massive funding toward the “Golden Dome” missile-defense shield. This strategy front-runs these massive IDIQ (Indefinite Delivery, Indefinite Quantity) awards.
Signal:
Monitor SAM.gov and Govini for “J&A” (Justification and Approval) documents. These are legal filings used when the government intends to bypass the bidding process and award a contract to a specific provider due to “Urgent Need.”
Quantitative Logic:
Unexpected Receivables (UGR): Quantify the delta between a firm’s “Expected Backlog” and new, unannounced contract “obligations” found in daily Treasury disbursement logs.
The Multi-Vendor Filter: For massive vehicles like the $151B SHIELD IDIQ, the model filters for companies like Kratos (KTOS) that are selected in “Tranche 1,” as they typically receive the highest “Task Order” volume in the following 12 months.
Example Trades:
Execute an Event-Driven Long on Kratos (KTOS) or Aerovironment (AVAV) the moment a J&A document for “Autonomous Attritable Spacecraft” hits the procurement feed, capturing the 8–12% “jump” that occurs before the news hits Bloomberg or Reuters.
C. The “Talent Arbitrage” Factor (MDA/MDA Space)
In a specialized sector like space engineering, human capital is the ultimate leading indicator. If engineers from SpaceX or Blue Origin are moving to a mid-cap prime, it signals a massive R&D breakthrough or a scaling phase.
Signal:
Scrape LinkedIn Talent Flows and Glassdoor for hiring “Burstiness.” Companies like MDA Space or Calian Group often ramp up hiring for specific job titles (e.g., “SAR Radar Integration Engineer”) 3–6 months before a major mission announcement.
Quantitative Logic:
The Poaching Ratio: Track how many employees a firm is gaining from “Top Tier” space firms vs. losing to them. A positive “Net Talent Flow” from SpaceX to MDA Space is a strong signal of internal growth.
Skill-Cluster Analysis: If a company suddenly starts hiring for “Lunar Surface Power Systems,” you can correlate this with upcoming Artemis contract phases that haven’t been priced into the stock yet.
Example Trades:
The model goes Long MDA Space when “Net Talent Flow” from US-based primes into their Canadian satellite assembly centers increases by 20% over a quarter, predicting the Radarsat+ Replenishment contract expansion that was officially awarded in early 2026.
IV. Example Model Metrics
1. Standard Risk-Adjusted Metrics
Used to validate if the space-specific alpha justifies the high volatility of the sector.
Sharpe Ratio (Target > 2.0): Measures excess return per unit of volatility. Space stocks often have high “Beta,” so a high Sharpe is critical to prove your “Launch” or “Signal” signals aren’t just noise.
Maximum Drawdown (Target < 15%): The “Rocket Failure” guardrail. Since an in-flight anomaly can tank a stock like RKLB or LUNR by 20% in an hour, your MDD must be tightly controlled through position sizing.
Profit Factor (Target > 1.75): The ratio of gross profits to gross losses.
Information Ratio: Measures the strategy’s ability to generate excess returns relative to a benchmark (e.g., the Procure Space ETF - UFO).
2. Launch & Logistics Metrics (Sector-Specific)
These measure the accuracy of “Cadence” and “Scrub” models.
Scrub Prediction Accuracy: The percentage of times your model correctly identified a launch delay vs. the official FAA/Company PR.
Cadence Delta: The difference between your Poisson-predicted quarterly launch count and the actual results reported in earnings.
IV Crush Capture: For the “Lunar Landing” strategy, measure the profit captured from the volatility drop immediately after a “Signal Lock” is confirmed, regardless of the stock’s direction.
3. Satellite & D2C Metrics (Sector-Specific)
These validate data-driven demand and signal models.
Signal Stability Lead-Time: The number of hours/days your crowdsourced RF data identified a “Service Ready” state before the company’s official announcement.
Tasking Correlation Coefficient: The statistical correlation between a spike in satellite “re-visits” over a specific zone (e.g., a lithium mine) and the subsequent revenue surprise in the following quarter.
Churn Lead Indicator: The accuracy of “Dead Zone” internet traffic drops in predicting subscriber losses for legacy operators like Viasat.
4. Prime & Component Metrics (Policy Alpha)
These measure ability to “front-run” government capital flows.
J&A Alpha Decay: How quickly the 8–12% “jump” occurs after a Justification & Approval document hits the gov feed (used to optimize your execution speed).
Patent Forward-Citation Growth: A metric tracking how many new citations your portfolio companies’ patents receive from larger primes (Lockheed, Boeing, etc.) as a proxy for technological “moat” strengthening.
Net Talent Flow (NTF): The ratio of engineers hired from “Top-Tier” (SpaceX/Blue Origin) vs. departures. A positive NTF is a 6-month leading indicator of R&D breakthroughs.
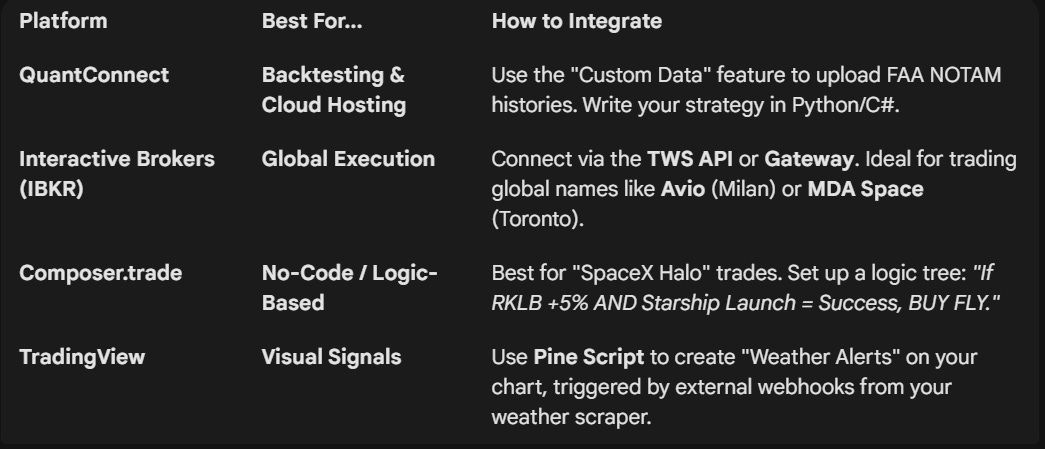
V. Space Quant Trading Bots
Need a specialized technical stack that can ingest non-standard data (telemetry, government PDFs, weather) and trigger trades within milliseconds.
1. The Space-Bot Architecture
A. The Ingestor (Non-Financial Data)
Unlike typical bots that only watch price, the ingestor must scrape “Space-Alternative Data.”
The NASA/DSN Scraper:
Uses Python’s
BeautifulSouporSeleniumto monitor the Deep Space Network status page for “Signal Lock” telemetry during lunar landings.
The SAM.gov Listener:
A custom webhook that triggers when specific keywords (e.g., “SHIELD IDIQ,” “Sole Source,” “Radarsat”) appear in new government procurement filings.
The Weather Filter:
An API call to OpenWeather or NOAA to calculate the “Scrub Index” based on upper-level wind shear at the launch pad.
B. The Strategy Engine (Logic)
This is the brain where your Poisson Cadence or Patent Velocity models live.
Frameworks:
Use
Pandasfor data manipulation andXGBoostorPyTorchfor predicting the probability of a “Launch Scrub” based on historical weather patterns.
Backtesting:
Platforms like QuantConnect (using the Lean engine) allow you to upload custom “Alternative Data” sets to see how your signals would have performed during past missions.
C. The Execution Gateway
This converts a signal (e.g., “Signal Lock Confirmed”) into a buy order.
Integration: Use the
ib_insynclibrary for Interactive Brokers or the Alpaca API for commission-free, high-speed execution.